Community Contributions#
These are a few contributions by the community.
Agile Price Table#
If you're wanting to display upcoming prices in a nice readable format, then you can utilise the Octopus Energy Rates card developed by @lozzd.

Greenness Forecast#
If you're wanting to display greenness forecast in a nice readable format, then you can utilise the Octopus Energy Greenness Forecast Card developed by @elyobelyob.

Home battery prediction and charging#
If you use OE with a home battery, you might be interested in predbat, which can take advantage of the data available through this integration.
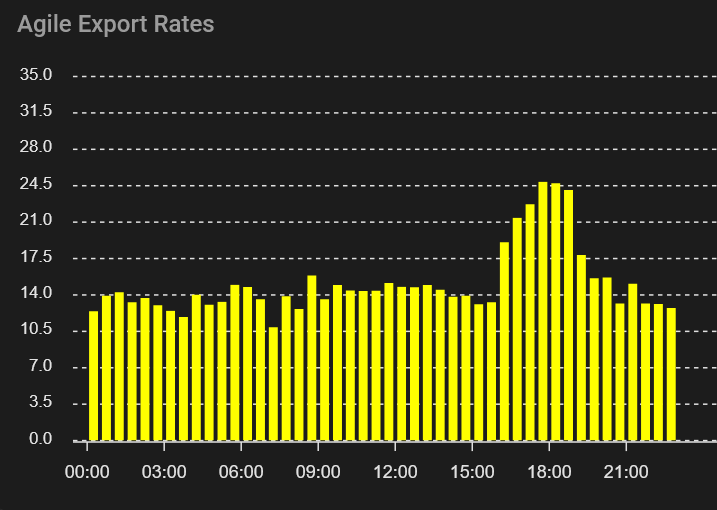
Import and Export Rates Charts#
Thanks to @fboundy you can use ApexCharts Card to plot the import and export rates for the current day using the following configuration.
Remember that the import and export current_day_rates and next_day_rates will be disabled by default and you will have to enable them and wait for the next update of Octopus agile rates at 4pm before you can add this card to your dashboard.
Replace {{METER_SERIAL_NUMBER}}_{{MPAN_NUMBER}}{{_export} with your information and whether you want the import or export rate chart:
type: custom:apexcharts-card
header:
  show: true
  show_states: true
  colorize_states: true
  title: Agile {{Export}} Rates
graph_span: 1d
stacked: false
span:
  start: day
apex_config:
  legend:
    show: false
yaxis:
  - min: ~0
    max: ~35
    decimals: 1
series:
  - entity: >-
      event.octopus_energy_electricity_{{METER_SERIAL_NUMBER}}_{{MPAN_NUMBER}}{{_export}}_current_day_rates
    type: column
    name: ''
    color: yellow
    opacity: 1
    stroke_width: 0
    unit: p
    show:
      in_header: false
      legend_value: false
    data_generator: |
      return entity.attributes.rates.map((entry) => {
      return [new Date(entry.start), entry.value_inc_vat * 100];
      });
    offset: '-15min'
  - entity: >-
      event.octopus_energy_electricity_{{METER_SERIAL_NUMBER}}_{{MPAN_NUMBER}}{{_export}}_next_day_rates
    type: column
    name: ''
    color: yellow
    opacity: 1
    stroke_width: 0
    unit: p
    show:
      in_header: false
      legend_value: false
    data_generator: |
      return entity.attributes.rates.map((entry) => {
      return [new Date(entry.start), entry.value_inc_vat * 100];
      });
    offset: '-15min'
which will produce something like the following...
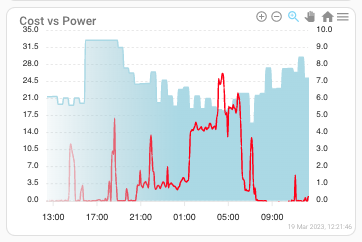
If you're looking for cost vs power using ApexCharts Card, then @plandregan has you covered with the following configuration. Replace {{METER_SERIAL_NUMBER}}_{{MPAN_NUMBER}} and sensor.givtcp_xxxxxxxxxxxx_grid_power with your information:
type: custom:apexcharts-card
experimental:
  color_threshold: true
header:
  show: true
  floating: true
  title: Cost vs Power
graph_span: 24h
show:
  last_updated: true
  loading: true
apex_config:
  legend:
    show: false
  chart:
    zoom:
      type: x
      enabled: true
      autoScaleYaxis: false
    toolbar:
      show: true
      autoSelected: zoom
    xaxis.type: datetime
  fill:
    type: gradient
    gradient:
      shadeIntensity: 0.1
      opacityFrom: 0.3
      opacityTo: 1
      inverseColors: true
series:
  - entity: sensor.octopus_energy_electricity_{{METER_SERIAL_NUMBER}}_{{MPAN_NUMBER}}_current_rate
    transform: return x * 100;
    type: area
    name: GBP/kWh
    yaxis_id: pence
    color: lightblue
    group_by:
      func: avg
      duration: 5m
    stroke_width: 2
    extend_to: now
    show:
      extremas: false
      header_color_threshold: true
  - entity: sensor.givtcp_xxxxxxxxxxxx_grid_power
    transform: return x /1000;
    type: line
    invert: true
    name: Power
    yaxis_id: kwh
    group_by:
      func: avg
      duration: 5m
    color: red
    stroke_width: 2
    extend_to: now
yaxis:
  - id: pence
    min: ~0
    max: ~35
    opposite: false
  - id: kwh
    min: ~0
    max: ~10
    opposite: true
which will produce something like the following...
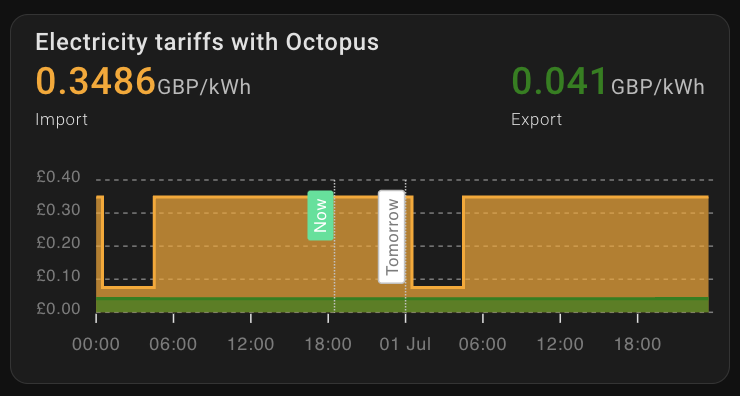
Import and Export Rates Chart#
If you're looking to combine import and export rates then create a card with the configuration. Replace {{METER_SERIAL_NUMBER}}_{{MPAN_NUMBER}} with your information:
type: custom:config-template-card
entities:
  - event.octopus_energy_electricity_{{METER_SERIAL_NUMBER}}_{{MPAN_NUMBER}}_current_day_rates
  - event.octopus_energy_electricity_{{METER_SERIAL_NUMBER}}_{{MPAN_NUMBER}}_next_day_rates
  - event.octopus_energy_electricity_{{METER_SERIAL_NUMBER}}_{{MPAN_NUMBER}}_export_current_day_rates
  - event.octopus_energy_electricity_{{METER_SERIAL_NUMBER}}_{{MPAN_NUMBER}}_export_next_day_rates
card:
  card_mod:
    style: |
      ha-card {
        --secondary-text-color: rgb(225,225,225)
      }
  type: custom:apexcharts-card
  show:
    loading: false
  color_list:
    - orange
    - green
  header:
    title: Electricity tariffs with Octopus
    show: true
    show_states: true
    colorize_states: true
  span:
    start: day
  graph_span: 48h
  update_interval: 30mins
  all_series_config:
    type: area
    float_precision: 4
    extend_to: now
    stroke_width: 2
    fill_raw: 'null'
  series:
    - entity: event.octopus_energy_electricity_{{METER_SERIAL_NUMBER}}_{{MPAN_NUMBER}}_current_day_rates
      name: Import today
      curve: stepline
      data_generator: |
        return entity.attributes.rates.map((entry) => {
          return [new Date(entry.start), entry.value_inc_vat];
        });
    - entity: event.octopus_energy_electricity_{{METER_SERIAL_NUMBER}}_{{MPAN_NUMBER}}_next_day_rates
      name: Import tomorrow
      curve: stepline
      data_generator: |
        return entity.attributes.rates.map((entry) => {
          return [new Date(entry.start), entry.value_inc_vat];
        });
    - entity: >-
        event.octopus_energy_electricity_{{METER_SERIAL_NUMBER}}_{{MPAN_NUMBER}}_export_current_day_rates
      name: Export
      curve: stepline
      data_generator: |
        return entity.attributes.rates.map((entry) => {
          return [new Date(entry.start), entry.value_inc_vat];
        });
    - entity: >-
        event.octopus_energy_electricity_{{METER_SERIAL_NUMBER}}_{{MPAN_NUMBER}}_export_next_day_rates
      name: Export
      curve: stepline
      data_generator: |
        return entity.attributes.rates.map((entry) => {
          return [new Date(entry.start), entry.value_inc_vat];
        });
  apex_config:
    tooltip:
      x:
        format: ddd dd MMM - HH:mm
    xaxis:
      axisBorder:
        show: false
      tooltip:
        enabled: false
    grid:
      borderColor: '#7B7B7B'
    legend:
      show: false
      toolbar:
        show: true
        autoSelected: zoom
        tools:
          zoom: true
          zoomin: false
          zoomout: false
          pan: false
          reset: true
    annotations:
      xaxis:
        - x: ${ new Date().setHours(24,0,0,0) }
          label:
            text: Tomorrow
        - x: ${Date.now()}
          label:
            text: Now
            borderColor: '#00E396'
            style:
              color: '#fff'
              background: '#00E396'
            borderWidth: 0
    yaxis:
      min: ~0
      max: ~0.4
      tickAmount: 4
      labels:
        formatter: |
          EVAL:function (val) {
           return "£" + val.toFixed(2);
          }
      forceNiceScale: true
    chart:
      height: 150
      foreColor: '#7B7B7B'
      zoom:
        type: x
        enabled: true
        autoScaleYaxis: true
to generate the following card...